Jan. 7, 2021, 1:09 p.m.
OpenWRT collectd Statistics to Grafana and InfluxDB
OpenWRT collectd Statistics to Grafana and InfluxDB
A much better and detailed guide can be found here: https://blog.christophersmart.com/2019/09/09/monitoring-openwrt-with-collectd-influxdb-and-grafana/
This is just a summary of my implementation of that tutorial.
We will install the luci-app-statistics package. Read the wiki for more information: https://openwrt.org/docs/guide-user/luci/luci_app_statistics
Installation of luci-app-statistics:
Login to your OpenWRT via SSH
Update opkg list
# opkg update
Install luci-app-statistics with collectd plugins and enable them:
# opkg install luci-app-statistics collectd collectd-mod-cpu collectd-mod-interface collectd-mod-iwinfo collectd-mod-load collectd-mod-memory collectd-mod-network collectd-mod-uptime collectd-mod-ping collectd-mod-rrdtool collectd-mod-wireless

# /etc/init.d/luci_statistics enable
# /etc/init.d/collectd enable
Sample output:
Upgrading luci-app-statistics on root from git-20.358.74878-e019fd2-1 to git-20.364.45011-a04ce80-1...
Downloading http://downloads.openwrt.org/releases/19.07.5/packages/mipsel_24kc/luci/luci-app-statistics_git-20.364.45011-a04ce80-1_all.ipk
Package collectd (5.12.0-1) installed in root is up to date.
Package collectd-mod-cpu (5.12.0-1) installed in root is up to date.
Package collectd-mod-interface (5.12.0-1) installed in root is up to date.
Package collectd-mod-iwinfo (5.12.0-1) installed in root is up to date.
Package collectd-mod-load (5.12.0-1) installed in root is up to date.
Package collectd-mod-memory (5.12.0-1) installed in root is up to date.
Package collectd-mod-network (5.12.0-1) installed in root is up to date.
Installing collectd-mod-uptime (5.12.0-1) to root...
Downloading http://downloads.openwrt.org/releases/19.07.5/packages/mipsel_24kc/packages/collectd-mod-uptime_5.12.0-1_mipsel_24kc.ipk
Configuring luci-app-statistics.
Configuring collectd-mod-uptime.
Collected errors:
 * resolve_conffiles: Existing conffile /etc/config/luci_statistics is different from the conffile in the new package. The new conffile will be placed at /etc/config/luci_statistics-opkg.
Configuring luci-app-statistics
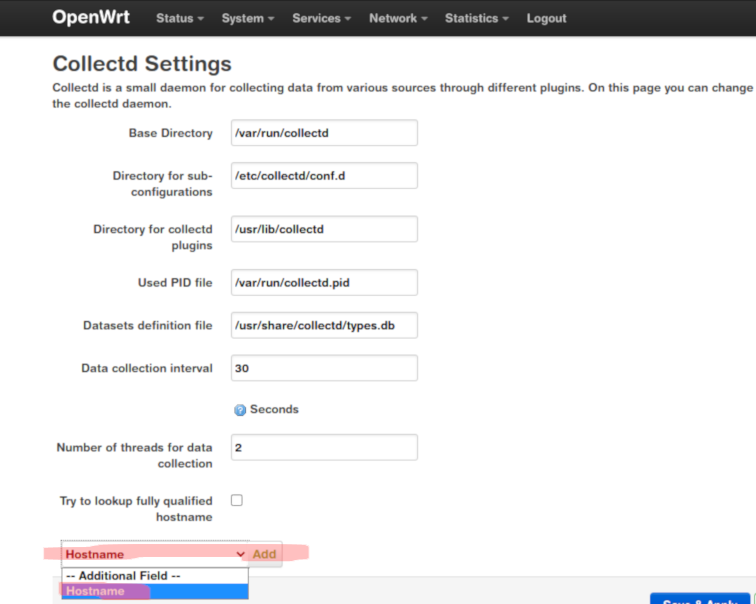
Login to your OpenWRT web interfac (luci), you should see the new menu named Statistics at the top menu. If you did not see it, try to restart the router. Click Setup and configure the collectd, In the Add field, click Hostname and name it to whatever you want. Now, click on the General plugins enable the plugins that you want, you are given Memory, Processor, System Load and Uptime. Click Save & Apply afterwards.
Now click the Network plugins, on the Ping plugin you can set this to monitor your upstream WAN ISP provided router (if you are in bridge mode). You can disable this if you don’t want to use the ping plugin. Save and apply.
Under Interfaces, select which interfaces that you want to monitor, hold SHIFT and click the target interfaces. Be sure to click Save & Apply.
We will enable the Wireless plugin but not select any interfaces to monitor, because OpenWRT will figure it out itself.
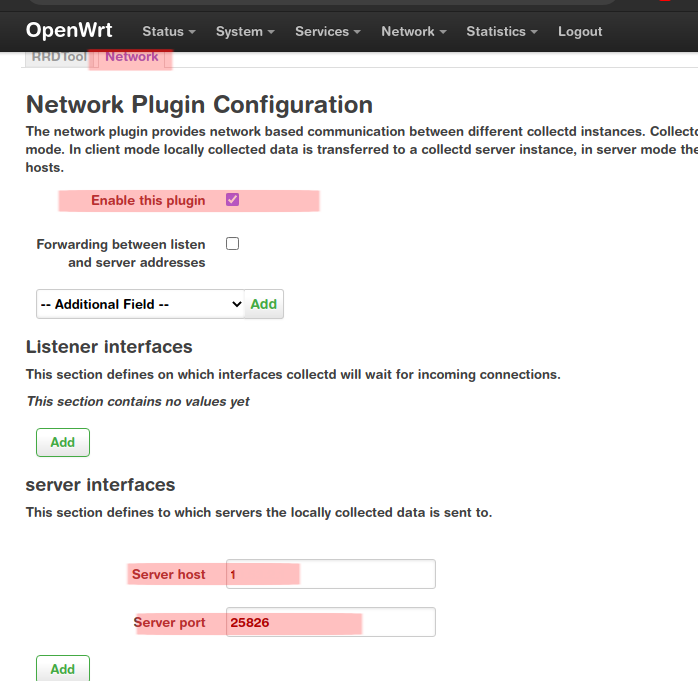
Finally, click the Output plugins > Network. Enable it and set the server interfaces, server host to the IP address of your InfluxDB (collectd listener) server. You can leave the RRDTool to still provide volatile statistics on your OpenWRT Luci Statistics Interface.
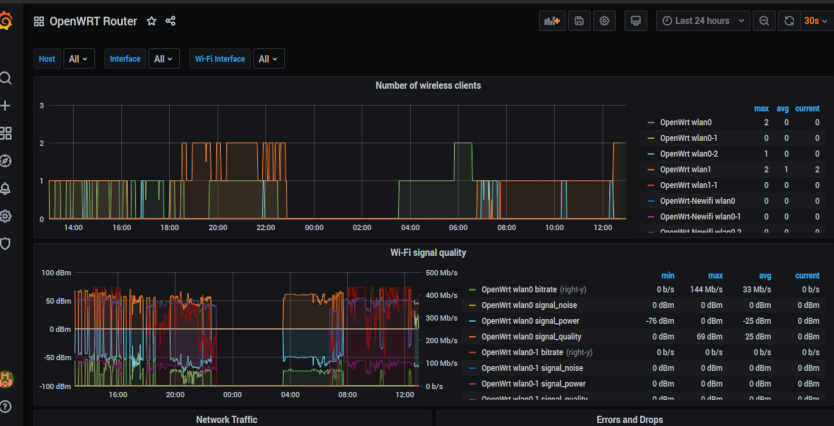
Logging in to Grafana and importing the OpenWRT Dashboard
Login to your Grafana, click the + sign and Import a new dashboard.
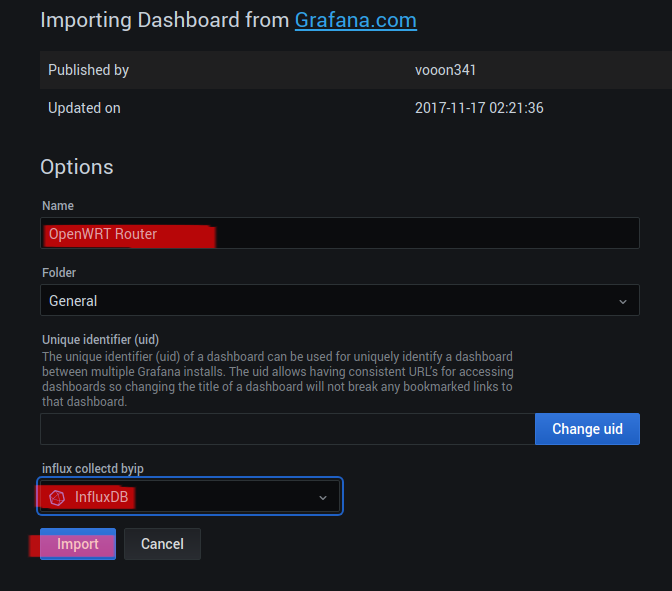
This contributed dashboard by vooon341 (https://grafana.com/grafana/dashboards/3484) is what we will use. Just type the number 3484 and click Load. Name your dashboard, select the influx collectd byip to the one that we configured on the last post. After clicking Import, Grafana will show the dashboard with the OpenWRT statistics.